LiftIgniter's RealTime Panel allows you to get up-to-date real time data on your site traffic and the performance of Liftigniter's recommendations. The panel has a number of different components, that provide insight into different aspects of your site's real-time metrics.
RealTime Chart
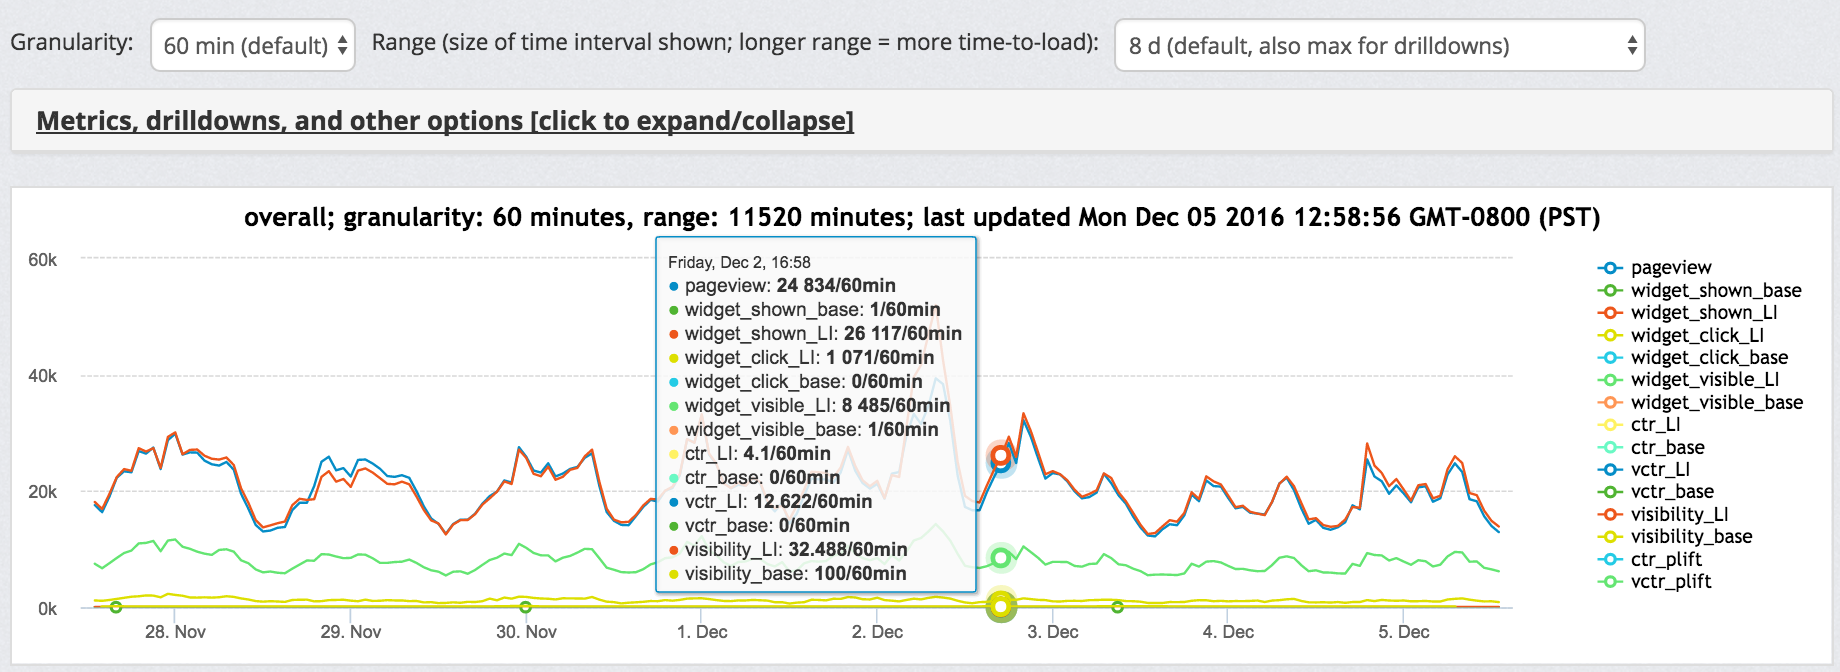
The real-time chart displays a number of metrics.

A sample real time chart for a customer who is not currently running an A/B test.
To get the metrics at any given point in time, you can hover over that point in the chart. The denominator ("/60 min") represents the display granularity. The time given is the end of the period for which the data is displayed. The time zone of display and the most recent update time for the chart are in the header on top of the chart.
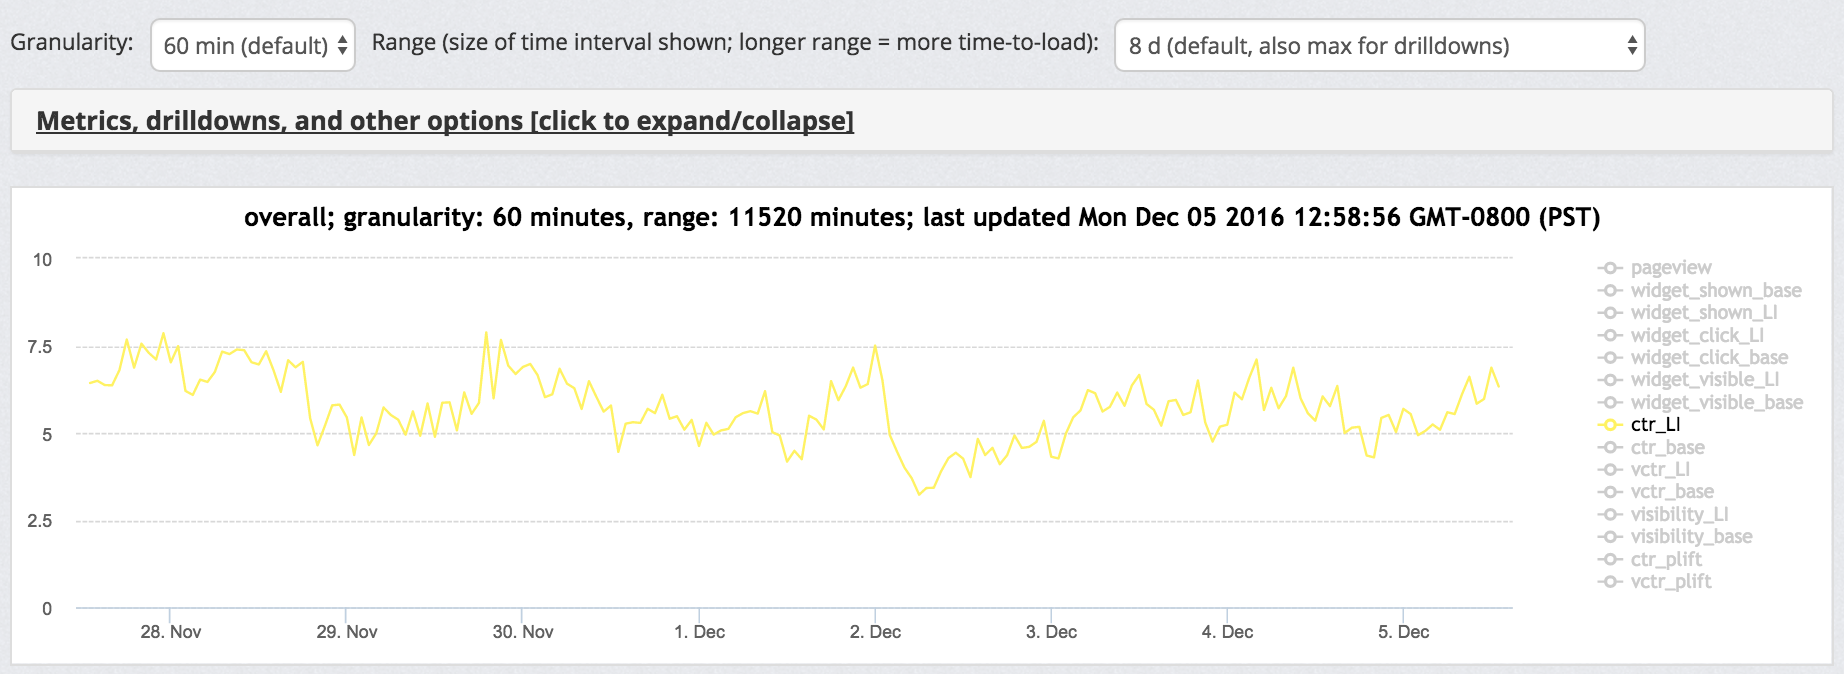
In order to focus on specific metrics, you can click on the metrics on the right to remove or reinstate them. For instance, if we want to only graph ctr_LI, we deselect all the other metrics and get something that looks like this.

A sample real-time chart, now looking only at CTR.
You can also edit the granularity (the size of the time interval covered by each data point) and the range (the total time interval) from the dropdowns above.
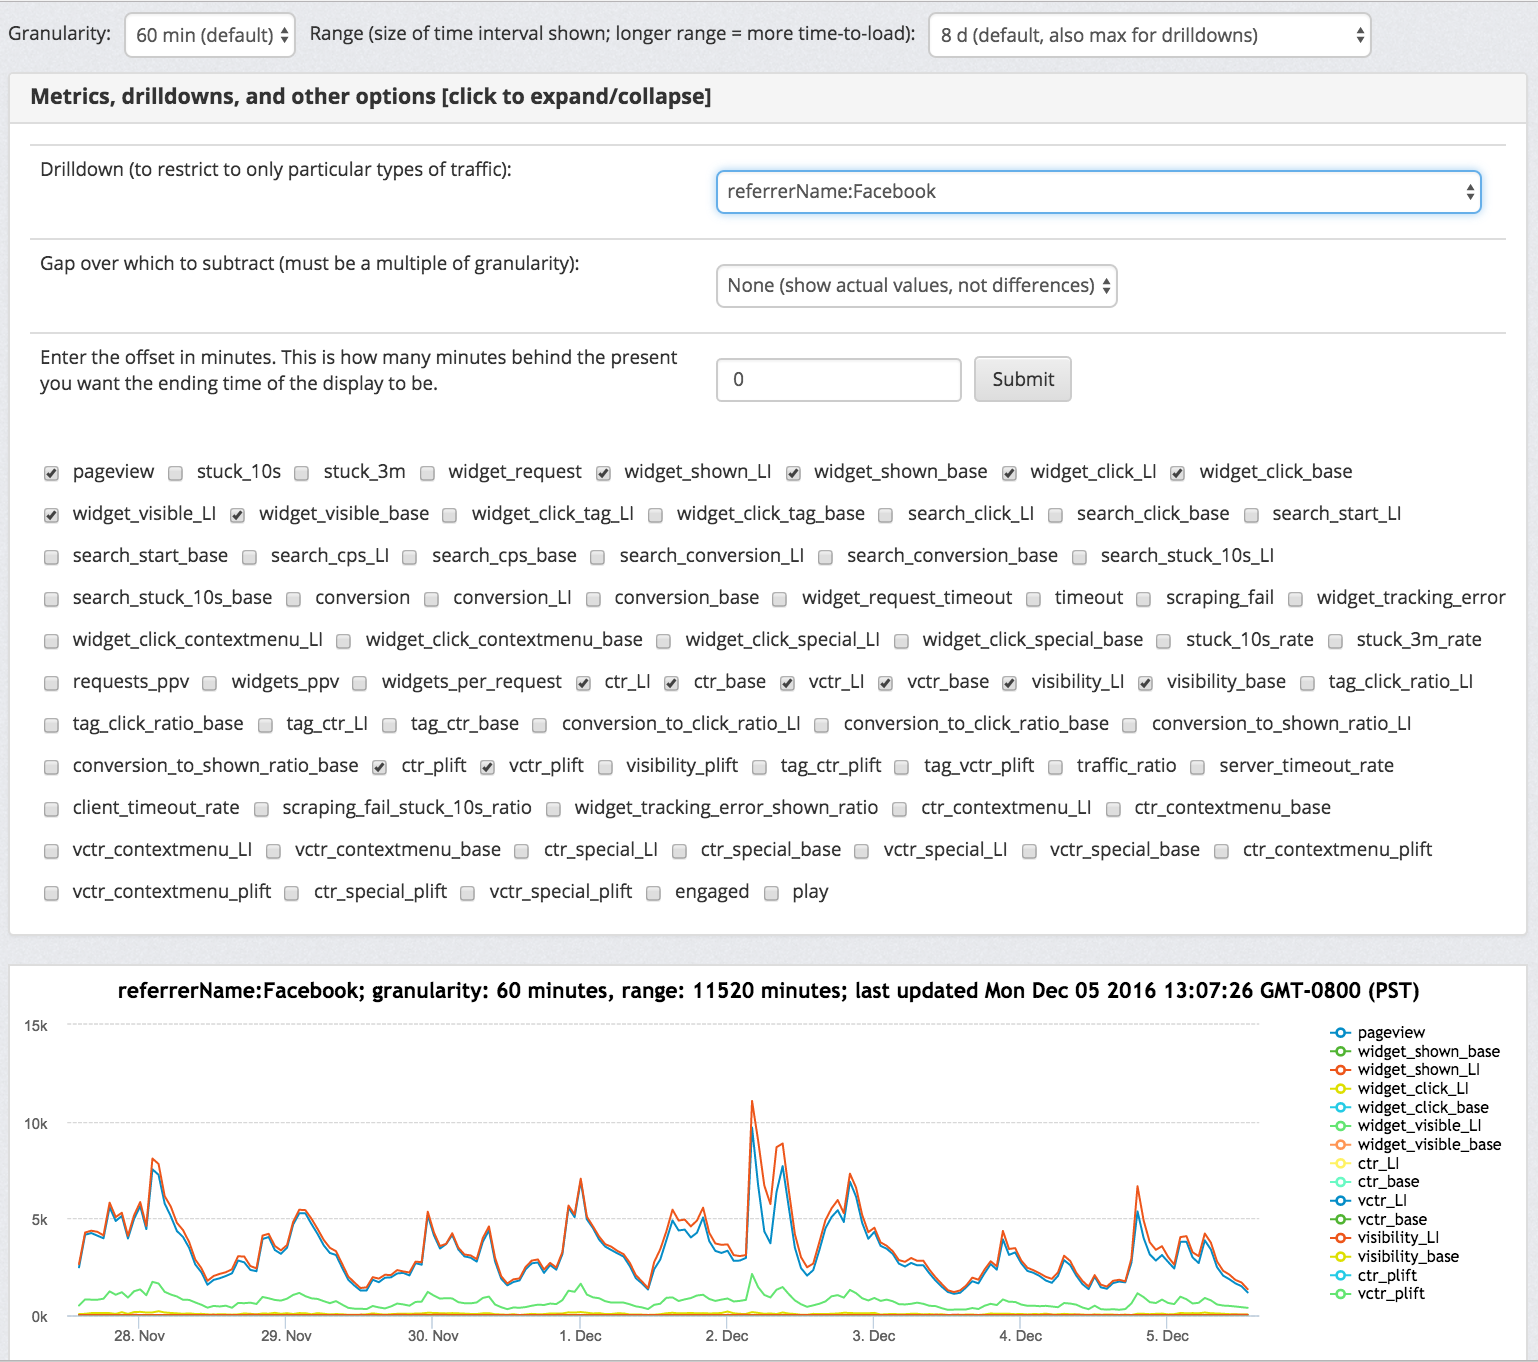
There are additional options for metrics and drilldowns if you click to expand/collapse. For instance, you can select the drilldown to filter to traffic with Facebook as a referrer, and get a new chart.

Facebook referral traffic. This includes any traffic in a session referred by Facebook regardless of whether the specific pageview was referred by Facebook.
You also have the option of selecting additional metrics to display from the giant list of metrics.
Note that every time you change a drilldown or select an additional metric, the entire chart refreshes. Refreshing the chart can take a few seconds.
Drilldown-based data is available only as far back as 8 days, whereas overall data is available as far back as 6 months. The finest granularity both for overall data and for drilldown-based data is 1 minute.
For up-to-date definitions of the metrics, click to expand "Summary of metrics and options" below the chart.
Top clicked: overall, by hour, and in a chart (available only after recommendation widget launch)
You might want to get deeper insight into the performance of individual items. There are three sections of the page that will help you get this insight.
The first section, called "Top clicked by drilldown", gives a list of the top-clicked items, with, for each item, the number of items the item was clicked, visible, and shown, as well as the computed CTR, VCTR, visibility. Alternate clicks and conditional CTR are included. Each metric has an information icon. Hovering over the icon explains the meaning of the metric.
These numbers are all-time numbers but older data is given less weight and gradually decayed. This is to keep the list reasonably up-to-date and relevant to the current context.
You can select a drilldown to filter only to the cases where that drilldown applies. For instance, selecting "referrerName:Facebook" as drilldown restricts to impressions in sessions that were referred from Facebook.
The second section, called "Top clicked by drilldown and hour", is similar, but only shows the data for a particular hour or grouping of adjacent hours. You can select how many hours behind to go, and how large a grouping of hours to consider. Starting mid-September 2016, we have started preserving this data indefinitely, so that you can go back as far as you wish to see this data.
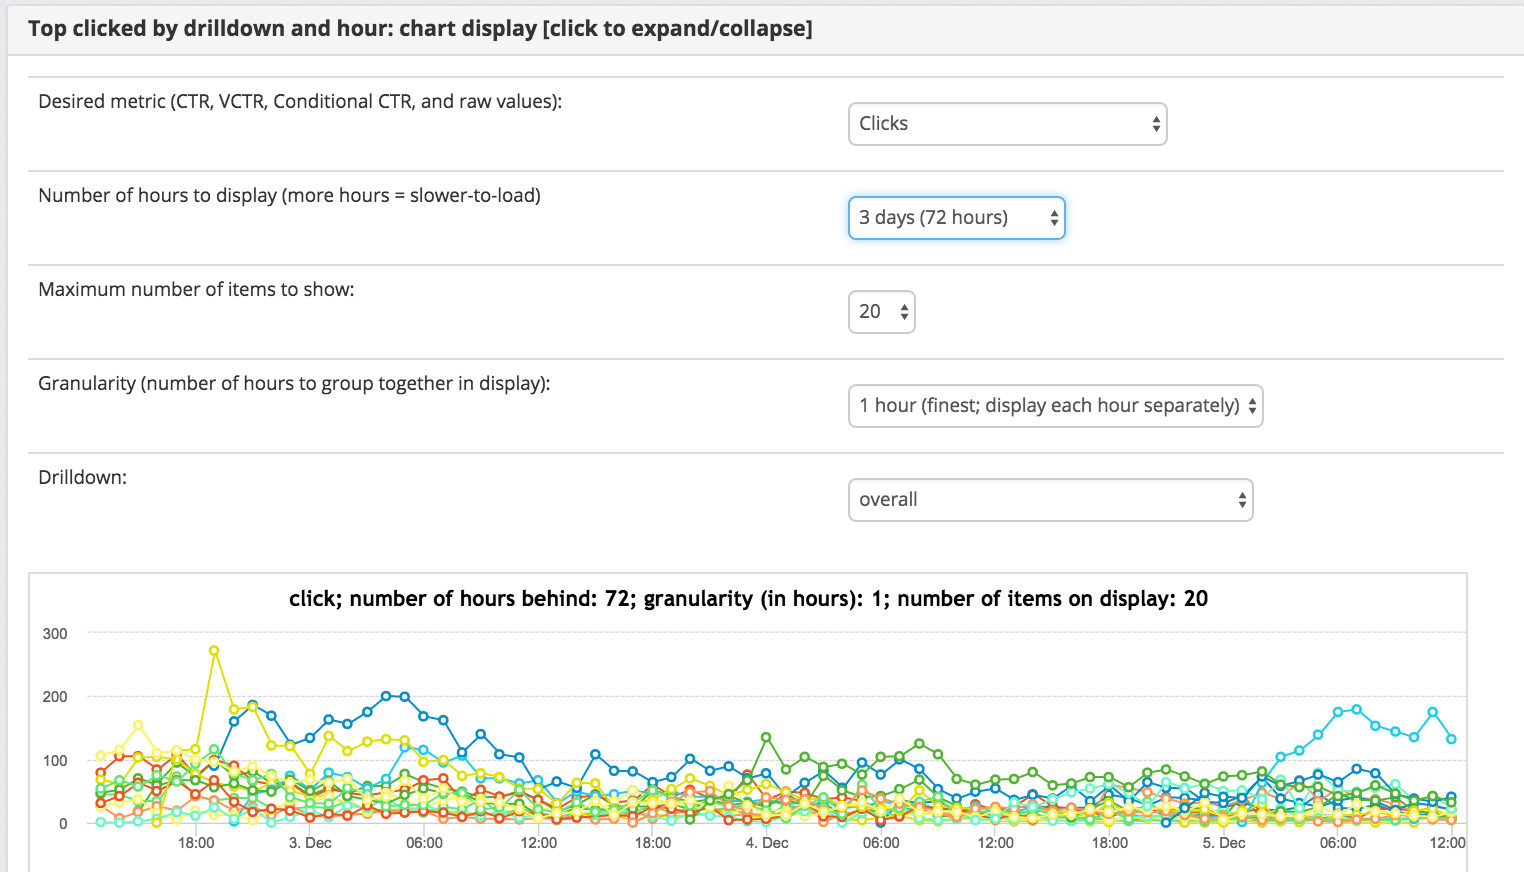
The third section is a chart display. This graphically displays how the top clicked items vary over time. You can select a metric to display (such as CTR, VCTR, Clicks), select the time range and granularity, and select how many items to show. An example screenshot is below.

Chart of top-clicked items at hourly granularity over a three-day period. The actual items (labels for the graph) are listed below the chart but are not shown in the screenshot.
Top viewed: overall, by hour, and in a chart
There are three sections here that parallel the corresponding sections for clicks. The main difference is that these sections are populated based on user view activity rather than click activity. In particular, they are populated after you start sending us data but before you lauch recommendations.
