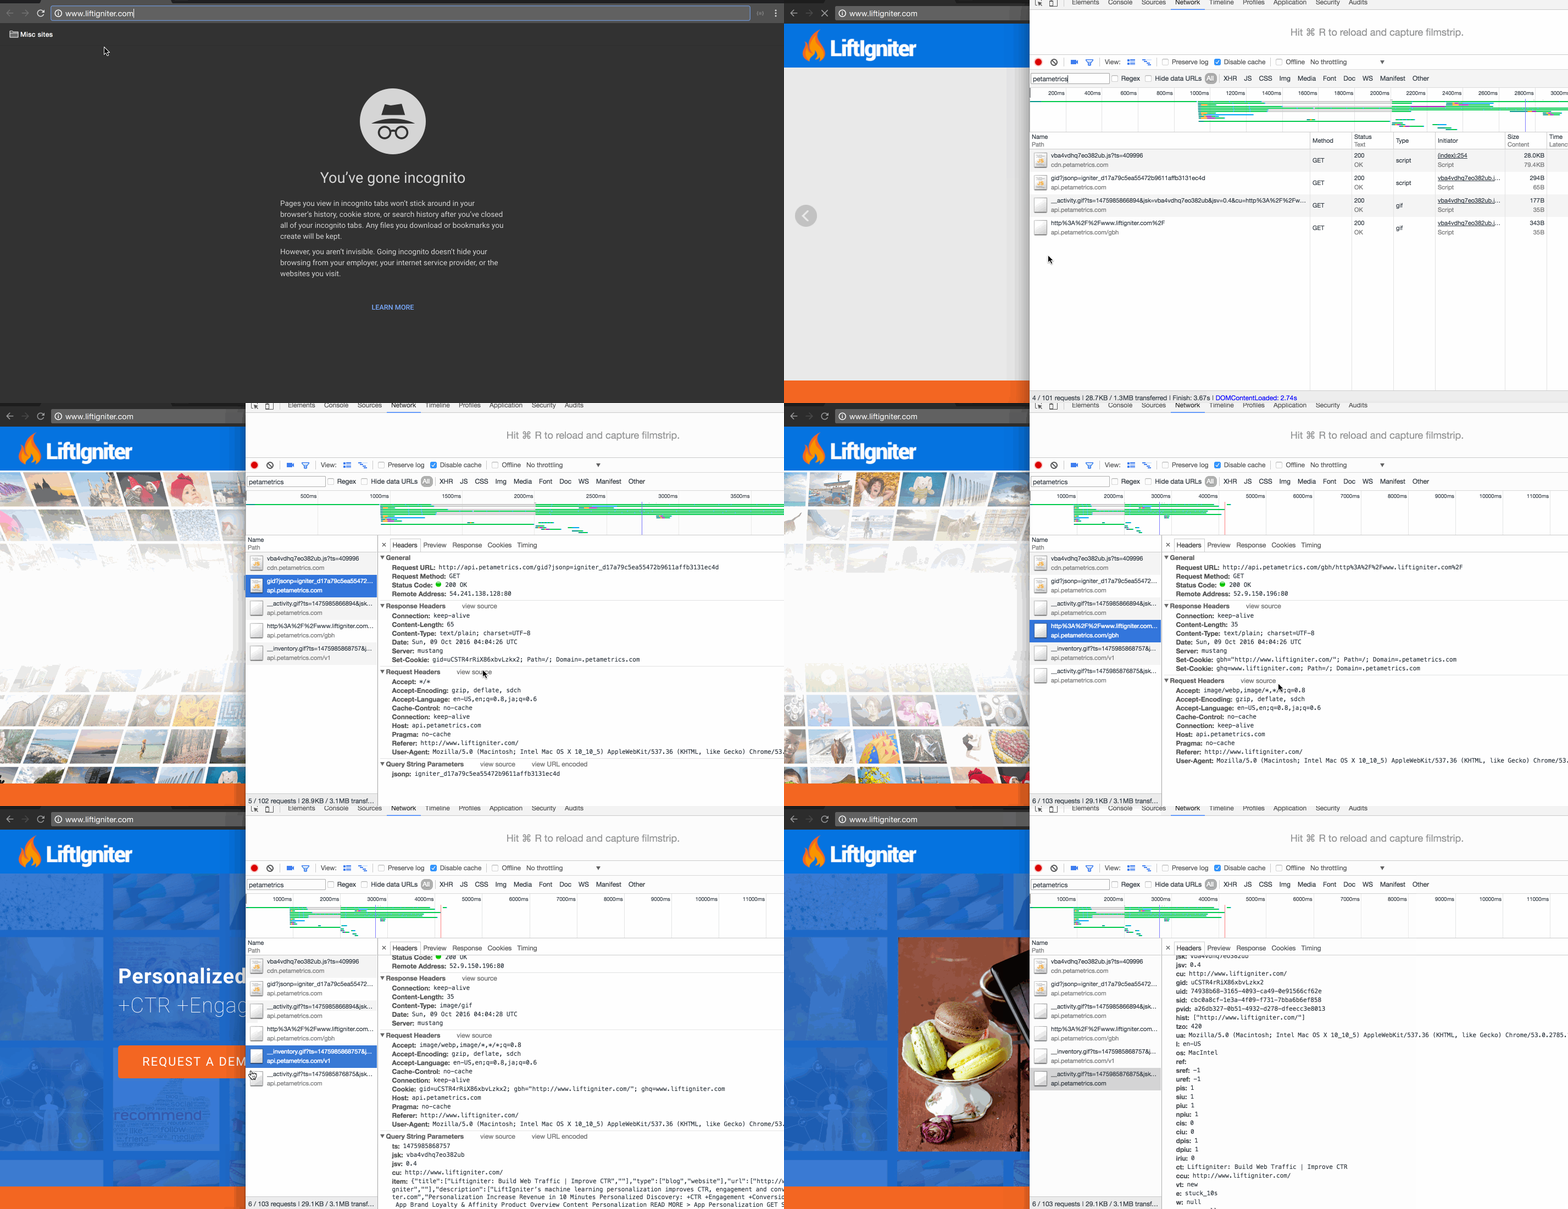
When a user loads a page on your website that has our Javascript snippet, here’s the order in which things happen. Keep the Network panel open, with the "petametrics" search filter. If things don’t work correctly, go to the Sources tab and check the box marking Call Stack as Async.
1. Sequence of events
- The user’s browser sees the instruction to load our Javascript file at cdn.petametrics.com. We respect the protocol the user is using to access the site: if the user is using HTTPS to access the site then they’ll access our Javascript via HTTPS as well.
- The user’s computer fetches the Javascript file from our CDN. When this happens, you’ll see a call to cdn.petametrics.com for the Javascript SDK file in the Network panel.
- The call succeeds, and you see a 200 OK response in the Network panel. If you click on it, you can then see the response, which is the full Javascript SDK file.
- The Javascript SDK file executes, and events are sent to query.petametrics.com. Almost immediately after Javascript SDK finishes loading, you’ll see a request to api.petametrics.com/__activity.gif. This is a pageview event being sent for us to record, and is triggered by the $p("send", "pageview") line in your Javascript snippet. You can click on it and see the headers to know what information was sent. If the information is sent successfully, you’ll see a 200 OK.

Sequence of petametrics.com events captured in the Chrome Network panel when visiting www.liftigniter.com
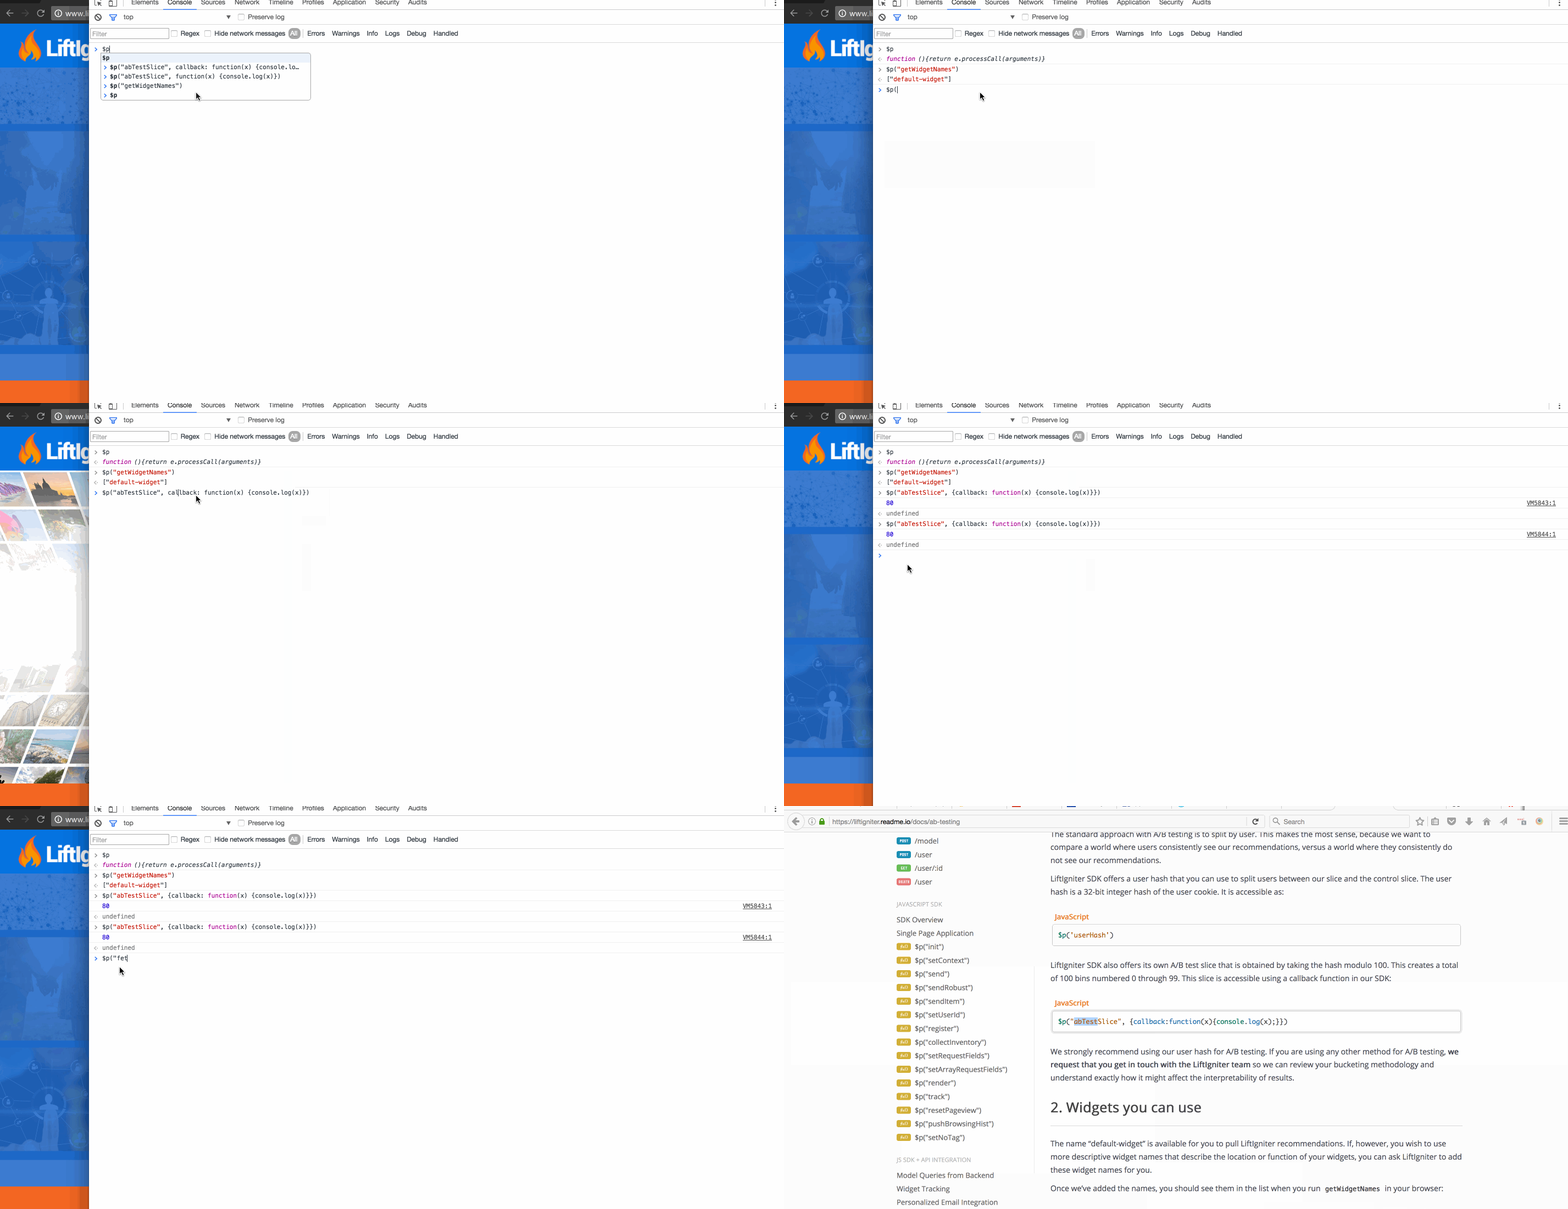
2. Check that our Javascript loaded using console
If you enter into the console:
$p
you should see this output:
function n.start.e.(anonymous function)()

Checking that the Javascript loaded successfully in the console on www.liftigniter.com.
3. Debug beacon loading issue
We process tens of millions of pageviews with our beacon every day, so it is quite unlikely that things will be broken. That said, here’s what you can do if our beacon is not working.
If no call was made to cdn.petametrics.com, this probably means that something went wrong with the Javascript snippet that you installed.
- Go to the Elements panel and see if the Javascript snippet is present in the head section. Verify that you copied it correctly from the dashboard.
- If you are using any ad-blocking or third-party blocking tools, make sure they are not blocking petametrics.com. For more information, see Ad blockers.
- Check your Console panel for any errors logged.
If a call was made, but gave an error (i.e., any code other than 200 OK):
- Note the error code so you can get in touch with us about it.
- Refresh the page to see if the error disappears.
- Check your network connectivity and check if you can directly load our Javascript in your browser.
- Check your Console panel for any errors logged.
If the call gave a 200 OK but "$p" in the Console panel gives an error, make a note of the error as well as the page on which you found it, and get in touch with Support. We’ll aim to fix it as soon as possible.
4. Caching and refreshing of our Javascript
If a user views multiple pages on your website, each of which has our Javascript snippet, the user’s browser will not fetch the Javascript from our server repeatedly. Rather, the browser will recognize that the resource was recently retrieved and will use that.
In order to make sure that the user’s browser periodically refreshes the Javascript file from our CDN, the Javascript snippet we ask you to install adds a timestamp parameter (that changes every hour) to the URL being fetched.
The parameter is ignored by our CDN, and is included solely so that your browser forces a reload of the file.
Legacy implementation
The Javascript that legacy customers had been asked to install did not include a timestamp parameter, and therefore was not guaranteed to refresh on the user’s side. We recommend you upgrade to the new Javascript snippet as soon as possible.
Disable cache during debugging
If you have Google Chrome Developer Tools, you can choose to enable or disable cache. The Disable cache checkbox is at the top of your Network panel. If you deselect the Disable cache checkbox, then usually, when you load the second page from a website, the request to cdn.petametrics.com will say "(from cache)" in the Size/Content column and "0 ms" in the Time/Latency column. The exception occurs when your page requests straddle the hour.
