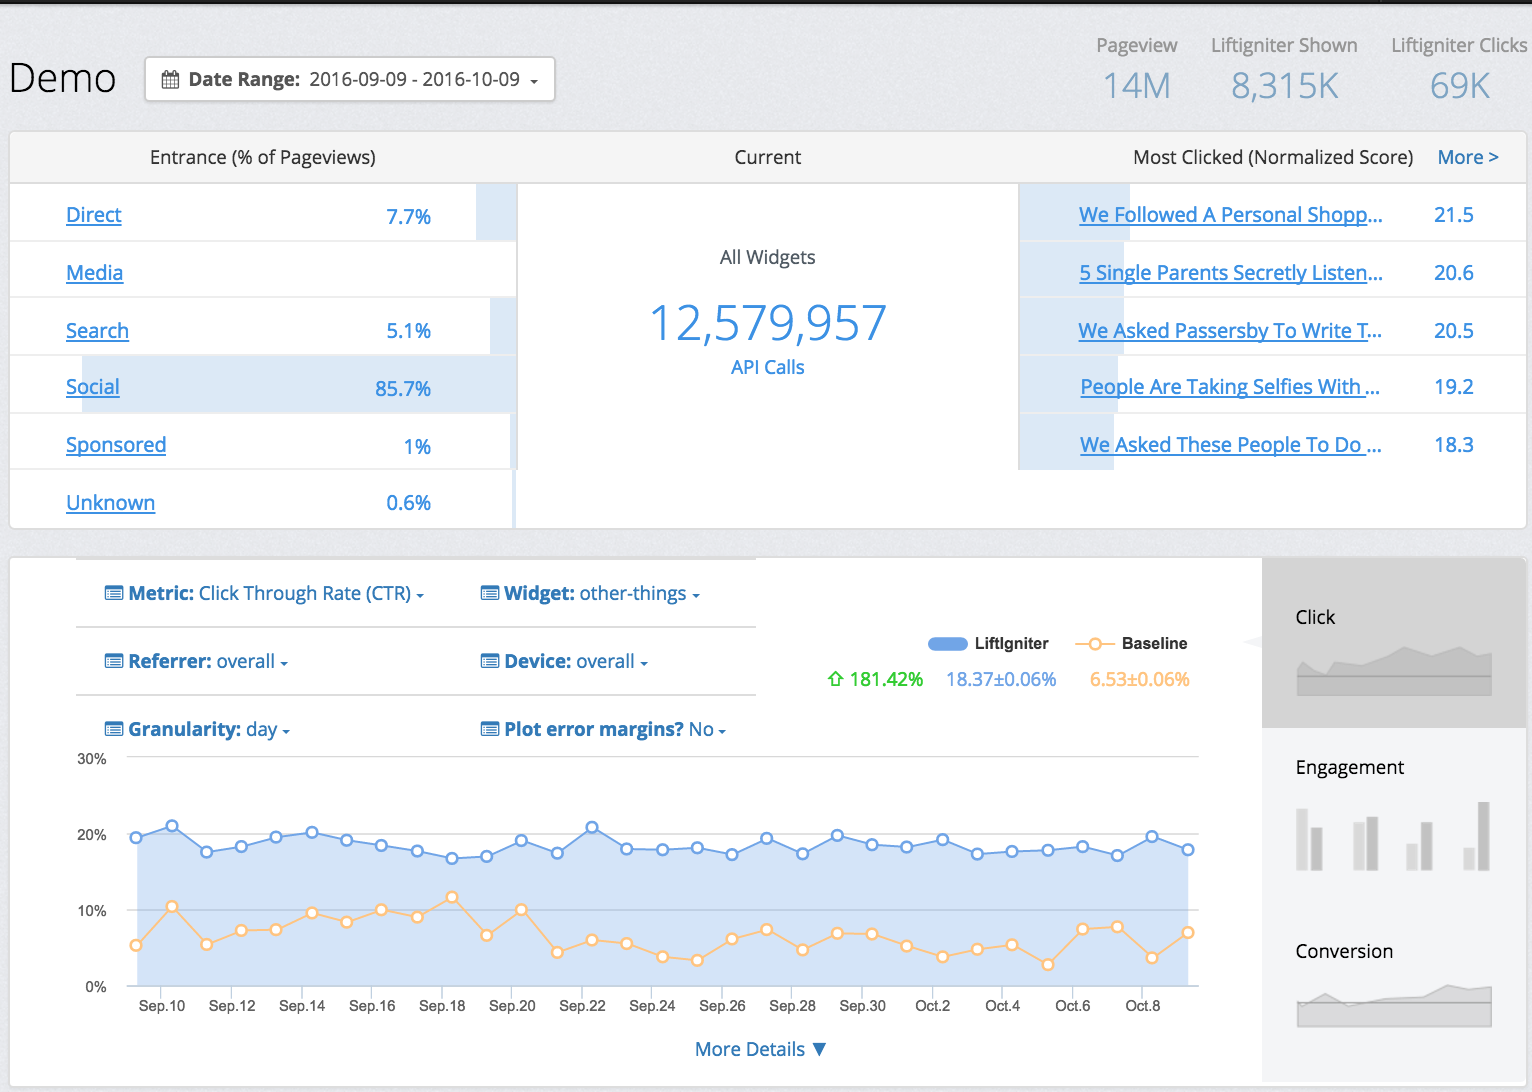
The Analytics Panel of the LiftIgniter Lab allows you to get analytics at a glance.

Sample LiftIgniter analytics panel. Note that data shown here is blended across different customers and therefore may not be internally consistent.
All sections of the Analytics Panel are controlled by the date range picker on the top left. As you change the date range, the numbers and charts in each section will change.
With the exception of the "Most Clicked" section, data for all other sections is available only at daily granularity, with days in Pacific Time, and updated daily around 6 AM Pacific Time with the previous day's data. Therefore, information for today and (if early AM Pacific Time, yesterday) will be missing. You can get the more up-to-date data from the RealTime Panel; however, this data does not have the same combinations of drilldowns and the numbers are less reliable because real-time data is not deduplicated.
Entrance (% of Pageviews)
The breakdown here is not specific to LiftIgniter widgets but rather covers your site-wide pageviews (as tracked by LiftIgniter). For each pageview (not necessarily the first pageview of a session) we look at the referrer to the first pageview of its session. We then classify this referrer as direct, media, search, social, sponsored, or unknown. For more on the available referrers, see Referrer, and count the percentages.
In particular, if two types of referrers refer the same number of sessions, but one of them creates much longer sessions on average, it will show up as contributing to a higher percentage of pageviews.
Note that this data is available by default only for customers who use our JavaScript beacon to send activity data. For customers using our API integration, you will need to include a sessionReferrer field in activities specifying the referrer of the session in order to see this data.
API calls
For customers who use our JavaScript beacon, this is the number of widgets you registered over the date range for which you successfully fetch recommendations. Note that success is measured on the server side: if our model server receives the request and completes computing the response, it is counted as an API call. It is possible that the API call is counted even though the recommendations are not actually rendered (for instance, because the user bounces off the page).
The number of API calls as reported here should match the number of API calls that you see in your monthly bill, if your bill includes a cost component for API call fees.
This API calls number does not include any calls made by LiftIgniter internally as part of status checks, or any calls made through the LiftIgniter Lab to test recommendation quality.
If you have not yet launched LiftIgniter recommendation, the API call number should be 0, or close to 0 (it could be a little more if you were testing recommendations).
Most Clicked (Normalized Score)
This is a list of the most clicked items over the date range. The normalized score is obtained as follows: we take the 20 most clicked items over the date range, and then express the clicks on each of the top 20 as a percentage of the total number of clicks on the top 20.
We do not show items that do not exist in our inventory. In particular, if you have fast-moving inventory, selecting an older date range might show an empty list.
You can get more up-to-date and detailed information on clicked items in the RealTime Panel. This will include items no longer in the inventory as well, though these will show up only as the URL rather than the title.
This list starts populating only after you have launched tracking on LiftIgniter recommendations.
Performance chart
The performance chart is the centerpiece of the Analytics Panel. It allows you to get a bird's-eye view of how LiftIgniter has been doing on your overall traffic as well as how it has been doing on specific traffic segments.

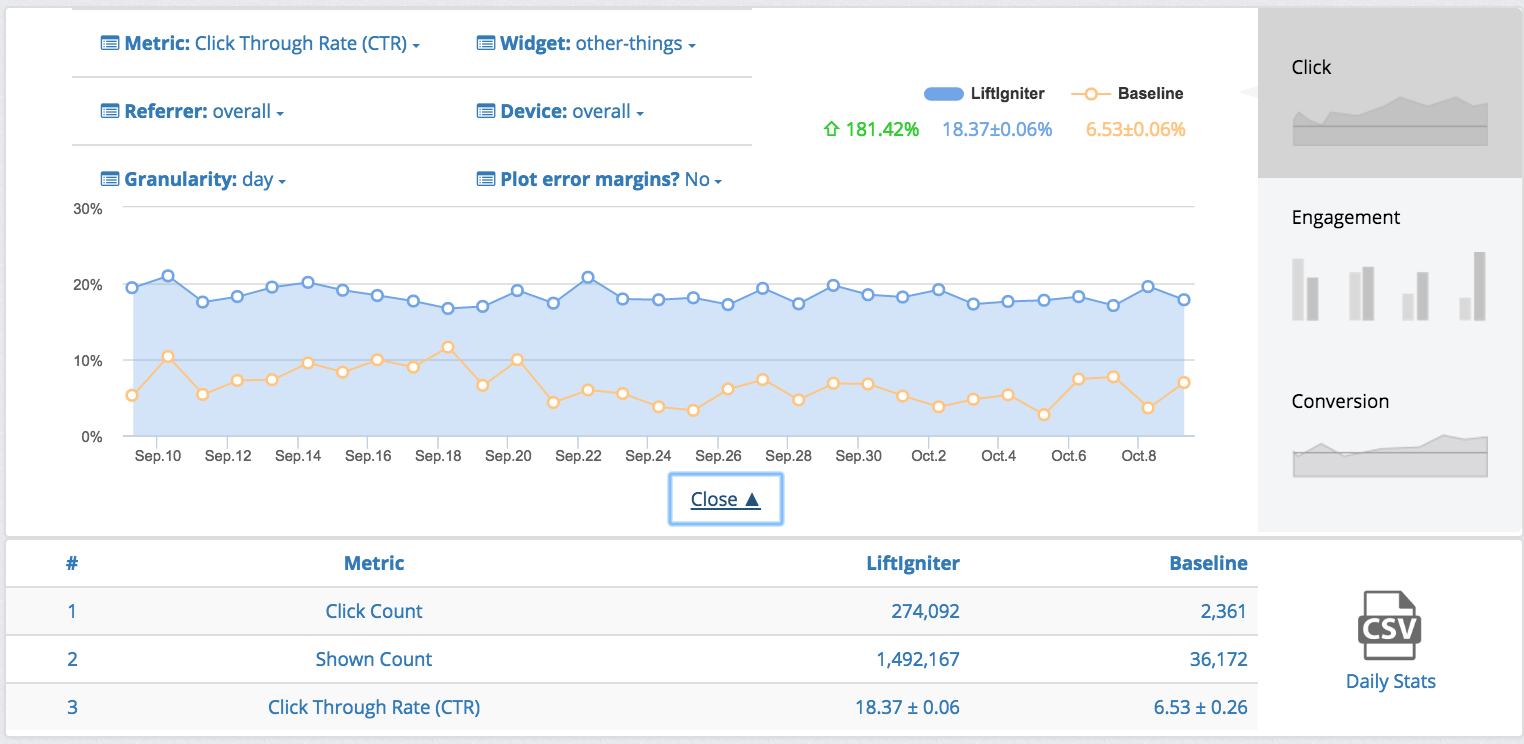
Performance chart section of the Analytics Panel.
Here's the different options you can change in the chart:
- Metric: You can change the metric between the different metrics available. Note that some metrics are under "Click", some are under "Engagement", and some are under "Conversion". You may need to toggle between these on the right before being able to access your desired metric. For a full description of available metrics and what they mean, see Metrics summary.
- Widget: LiftIgniter recommendations are shown in widgets, and you can get all metrics separately for each widget. You can also select "overall" to get combined numbers across widgets.
- Referrer: You can filter traffic by referrer type (direct, social, search, media, sponsored, unknown) and get all metrics for the filtered traffic.
- Device: You can filter traffic by device type (desktop, mobile, tablet, unknown) and get all metrics for the filtered traffic.
- Granularity: You can select a granularity of day, week, month, year, day-of-week, and month-of-year. For day, week, month, and year granularities, we group data based on your selected granularity and show it using the earliest data point of the time period. For day-of-week granularity, we show the weekly cycle, choosing the most recent week for labels. For month-of-year, we show the annual cycle.
- Plot error margins: This plots the error margins as separate graphs for the metrics displayed. You can therefore see the error margins for each data point.
In addition, you can change the date range at the top of the Analytics Panel.
On the top right, you see a summary of the numbers: the overall value of the numbers for LiftIgniter and baseline over the entire time period selected, along with error margins (when the number is a ratio). If applicable, a percentage lift will also be shown.
Below the graph, you will see the summary of the metric totals for that metric. If the metric is defined as a ratio of two other metrics, then data for those other metrics is also included.
From the bottom right, you can download a CSV summary of the data. This includes all metrics in the given selection (Click, Engagement, or Conversion).
