This is a detailed guide to debugging issues with our Javascript and recommendations. It’s meant for recurring issues. For urgent matters, please contact us at Support. For the most part, you shouldn’t need to use this debugging guide at all!
The detailed instructions here are written for Google Chrome Developer Tools, that you can access within the Google Chrome browser. When debugging what’s happening, it’s important to keep Developer Tools open before you load the page. If you have not used Developer Tools before, check out the Chrome DevTools Overview. Similar debugging can be done using the developer tools of other modern web browsers.
1. Diagnostics
To diagnose basic issues with the JavaScript SDK, execute $p("runDiagnostics") in your browser's web console. This should work if the snippet loading LiftIgniter has executed, and the load of our JavaScript file was successful.
2. The Network panel
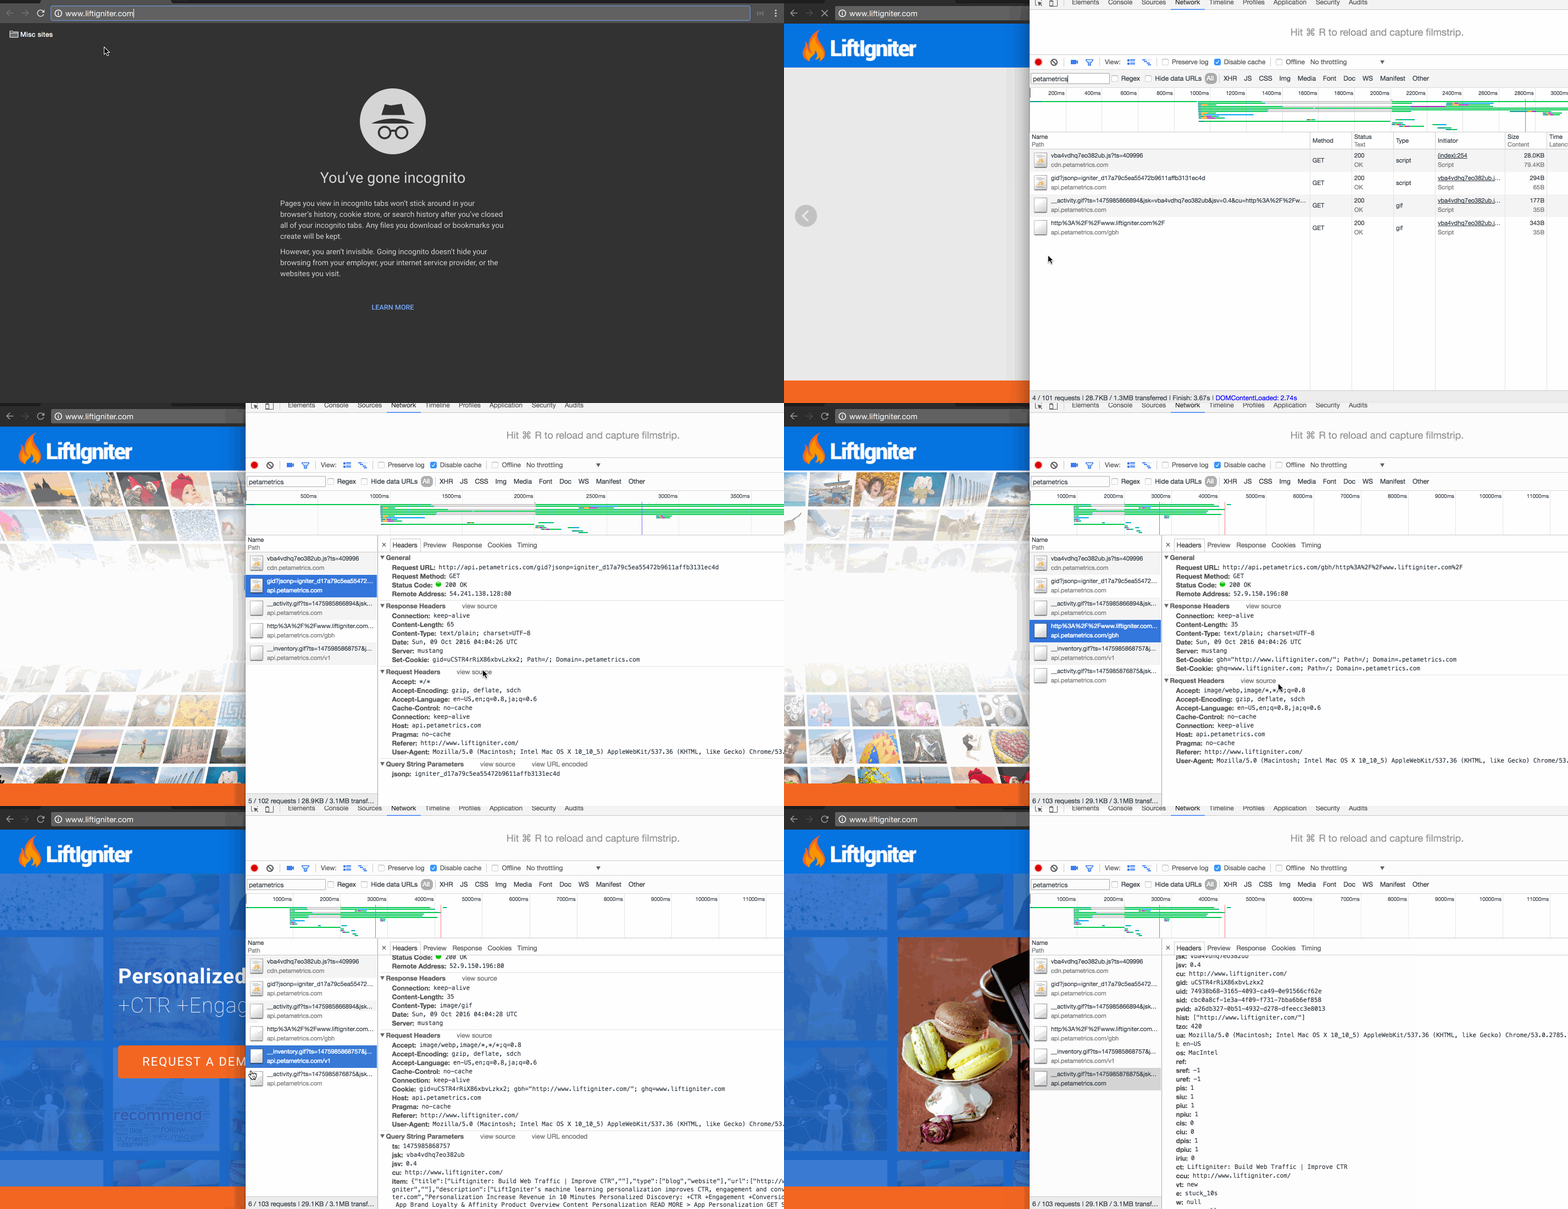
You can use the Network panel to track all requests made to different domains. You can obtain the request headers, response, and the time taken to execute the request. All requests relevant to LiftIgniter are under the petametrics.com domain. To see only these requests, enter "petametrics" (without quotes) in the search bar at the top of the Network panel. To keep your life manageable, type this in before you begin loading the page.
There are two subdomains to which requests are made:
- cdn.petametrics.com has our Javascript, and is loaded by the Javascript snippet you copy/pasted into the head of your HTML.
- query.petametrics.com receives activities, including pageviews, heartbeat events, and events related to widgets being shown, becoming visible, or getting clicked. It also receives queries for recommendations that you make through the Javascript SDK.
There are a few options that are of particular importance when debugging:
- Selecting the "Preserve log" option allows you to preserve information about requests as you navigate between pages. Note that although the request headers and latency information is preserved, the response data is not preserved when you navigate to another page. This should not adversely affect your debugging.
- Selecting the "Disable cache" option forces a reload of all resources on every page load, whereas deselecting it allows for resources to be loaded from the browser cache. This is relevant only for fetching our Javascript. API activities and model queries always hit our servers since no two of these are identical.

Sequence of petametrics.com events captured in the Chrome Network panel when visiting www.liftigniter.com
3. The Application panel (previously called the Resources panel)
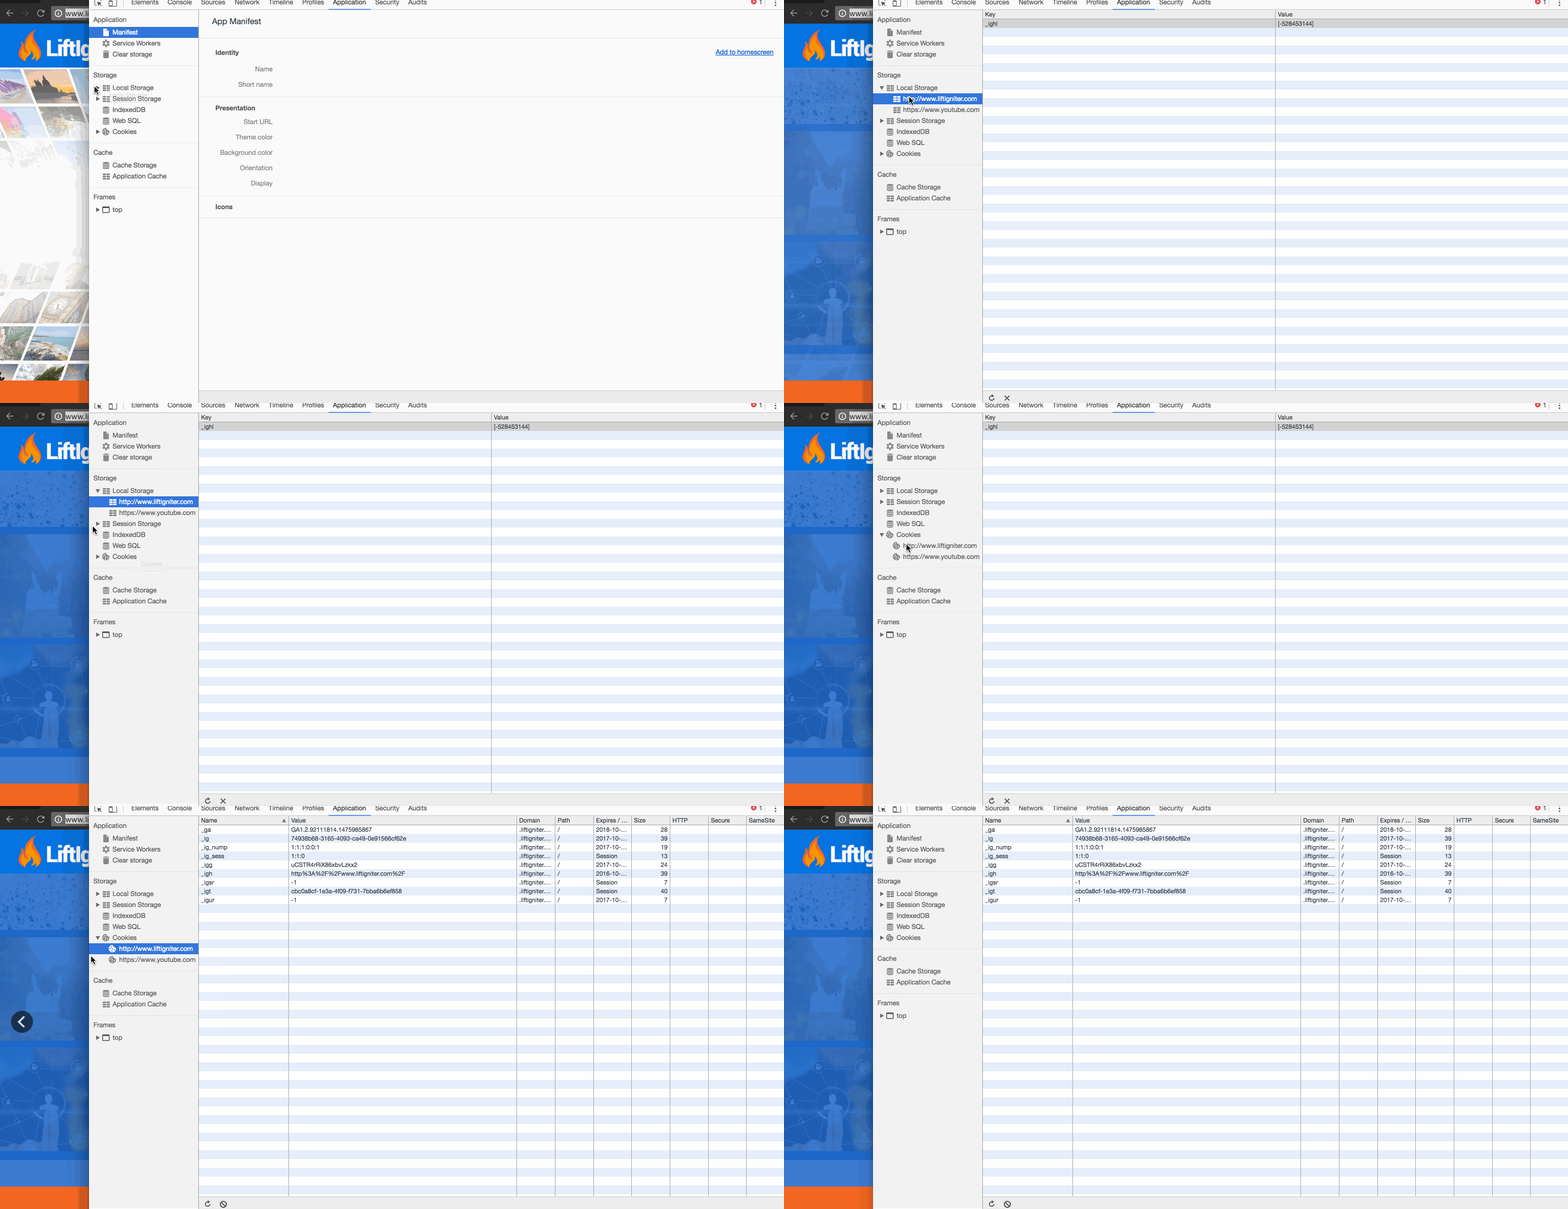
The Application panel has two sections relevant to LiftIgniter: the "Local Storage" and the "Cookies" sections. The "Local Storage" section is used by us to store some information, including URLs seen and clicked, in hashed form. It is also used to back up some events that need to be sent across different pageviews. It does not work in private browsing mode on Safari but it does work fine in Firefox and Chrome.
If your site is a mixed HTTP-HTTPS website, then cookies are shared correctly between HTTP and HTTPS, but the local storages are maintained separately.
All our cookies (with the exception of cookies used to help improve the Cross-site recommendation experience for customers who opt in to it) are stored as first-party cookies under your domain and are accessible under your domain in the Cookies section. LiftIgniter’s cookies are the ones that start with "_ig".

Local storage and cookies after a single visit to www.liftigniter.com in an incognito window on Chrome
4. The Elements panel
The Elements panel allows you to see the fully rendered HTML of your page. You can also edit the HTML and CSS and use this to test simple changes to your website. You can right-click on any element in your webpage and click "Inspect Element" to navigate to the HTML of that element in the Elements panel.
The Elements panel is useful for checking whether you successfully rendered LiftIgniter’s recommendations on your webpage.

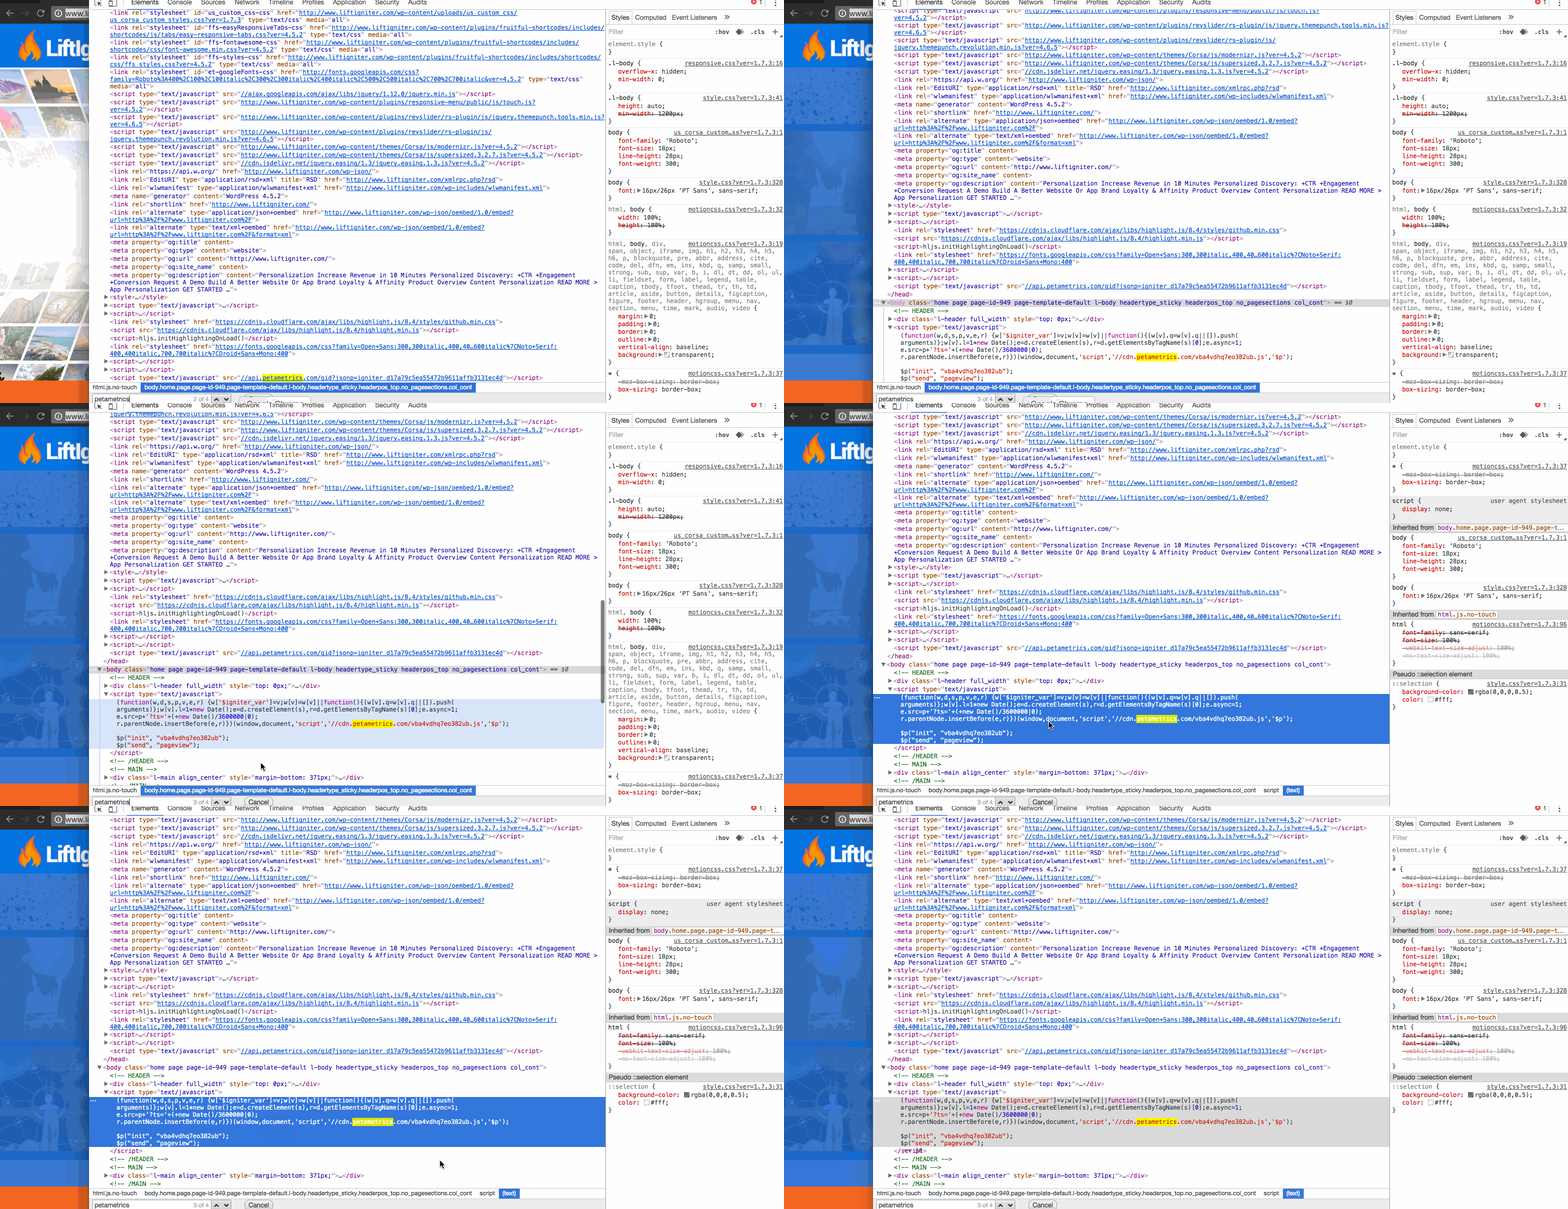
Locating the LiftIgniter snippet in the Elements panel of a website (www.liftigniter.com) that uses it.
5. The Javascript Console panel
The Javascript Console panel is a good place to check the values of variables and run our Javascript SDK functions for testing, including $p("runDiagnostics"). Our functions are called with "$p".
This panel is also where Javascript execution errors as well as console log statements are stored. Errors appear in red font against a pink background. These could include errors of failure to load scripts, as well as other Javascript errors. Console log statements appear in black against a white background.
6. The Emulator
Chrome’s Developer Tools has an Emulator that allows you to emulate different device types and allows you to throttle network speeds to emulate poorer connectivity. This is particularly helpful if you render your site differently on mobile devices and tablets.
It is important to keep in mind that the Emulator does not actually emulate different operating systems. It only adjusts the screen size for rendering and the user agent that is communicated to websites. Therefore, rendering details that are specific to some operating systems or devices will not be captured by the Emulator. To test for these, you may need to use a cross-browser testing tool.
